
Computers can predict how successful a book will be — or so ran the headlines a few years ago following university researchers’ publication of Success with style.
A bold claim and if true and it could benefit many people; the writer looking for feedback, the literary agent or publishing house reader swamped among the piles of manuscripts, politicians looking for the next great speech. But can artificial intelligence or machine learning really predict the success of books?

Machine learning and writing
The researchers who came up with the Researchers at Stony Brook University in New York — Vikas Ashok, Song Feng and Yejin Choi — reduced stories and poems into their linguistic components and published the results. They claimed that success or failure is related to how types of words made up a text.
Their paper,
Success with style: using writing style to predict the success of novels, got a lot of attention at the time and has been cited multiple times since. Yet despite that happening in 2014, no publisher or agency has announced they’re replacing their readers with machines.
This may be in part because the authors didn’t detail their methods, and because the success rate was not 100%. Yet I had other issues with the paper. And now I have completed my statistics studies I can return to address them.
Investigating success
Things I wanted to investigate from the original paper:
- the detailed methodology and how they got their results and why they chose to manipulate data in the way they did
- the definition of success – not mentioned in the paper is that the downloads used isn’t the total downloads of all time, it was downloads over the previous 30 days so could be skewed. Is this the right measure?
- the difference in proportions of success and failure was tiny, with no proportion being more than 1% – is this statistically significant?
- the readability score – although not set out in their aims, their readability score is not divided by genre (like other scores). Why?
Success with style: the original process
The original researchers looked at 5 measures in a text (largely looking at how language was distributed and the sentiment), and we’re only go to focus on two, Part of speech (PoS) tag distribution and readability as these were fleshed out the most in the paper.
A PoS tagger tags words based on its position and context, categorises then reports how these are found in the text and there are several tools to do this along with different tags to use. The Penn tagger is used in this paper although it wasn’t their highest scoring predictor of success (they claim it only had a 2/3 success rate) this is still better than what we’d expect by chance (50% as it was a simple success/failure test).
Yet the question that wasn’t asked let alone answered “are these results statistically significant?”. That is, are these results we should sit up and pay attention to, or are these just down to chance that there happened to be a difference in the selected books. Throughout I’ll use p>0.05 as my measure of significance.
Success with style methodology
The original paper doesn’t detail the methods used, nor the hypothesis. As we’re going to perform statistical tests we’re going to we’re going to create a hypothesis.
If you haven’t come across a hypothesis before, the idea is that you start an experiment with a null hypothesis (H0), usually that the current situation is correct. You then offer an alternative hypothesis (HA) that represents your research question.
You test as if H0 is true. If the test results don’t provide convincing evidence for the alternative hypothesis, stick with H0. If they do then reject H0 in favour of HA (note this isn’t the same as saying that the test proves that the alternative hypothesis is true).
I interpreted the original PoS hypothesis as:
H0: There's no difference in the distribution of the proportion of parts of speech (PoS) tags in successful and unsuccessful books, regardless of the book's genre.

HA: There is a difference in the distribution of the proportion of PoS tags in successful and unsuccessful books, and the pattern will depend on a book's genre.
For readability (I’ll be using the Flesch-Kincaid grade measure, where the lower the score the more readable the work. The original researchers only used FOG and Flesch, other measures, but this is the measure I’ve used elsewhere and so:
H0: There's no difference in the readability measure of successful and unsuccessful books, regardless of the book's genre.

HA: There is a difference in the readability measure of successful and unsuccessful books, and the pattern will depend on a book's genre.
Recreating the Success with style method
The original team used the Stanford tagger. I used the Perl Tagger as I already have it setup but, like the Stanford tagger, it uses the Penn Treebank to assign PoS tags to English text. It’ll also be of interest to see if a different PoS program creates any difference.
I’m going to:
- Get the source books and the metadata used in the original study.
- Run the books through the PoS tagger and readability analyser.
- Recreate their output data and compare it with the original results.
- Carry out statistical tests for the significance of the results.
I also use LIWC 2015, an alternative language tagger that I’ve used for past projects and will repeat.
Finally, as the original results didn’t account for the 30 days success/failure measure I’m going to reuse the same books to see if they have different downloads and if the accuracy is repeated.
Recreating the original results
Recreating the original results wasn’t easy. The image below is from the original paper, but how they got this is missing.
The output data offers a range of ways of interpreting it, but this is how it was created (all data links are at the end if you want the raw and manipulated data):
- Split the data into success/failure and sum all the tag data (eg all the CC tags, all the CD tags and so on).
- Work out the proportion of all tags the individual tags represent (eg for CC you get CC/(CC+CD+NN+…) in success/failure, so for the Adventure genre CC is 140,393/3,386,774 = 4.1%).
- For each tag subtract the value of the failure from the success proportion to give a net value (eg 4.14% – 4.223% = 0.08% difference) as shown in my table.
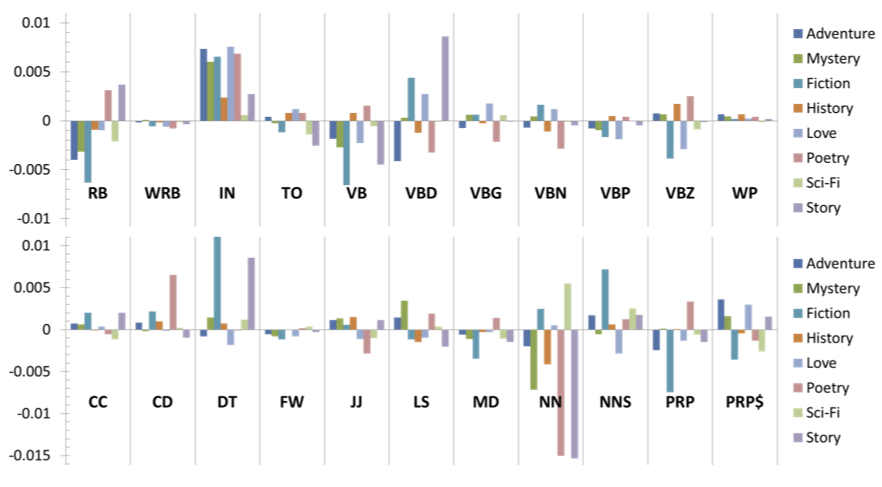
Here’s my intiial output (next time I’ll detail how I got it):
Not precisely the same but very close, and I’ve used similar colours and the same (rather odd) arrangement of tags for easy comparison.
I labelled the y-axis label in the charts to draw attention to the tiny scale of difference. The scale is a maximum of 1% difference, with most differences within ±0.5%.
This is minuscule and begs the question of whether this is statistically significant.
Next time
Part 1 is about the original experiment and going about recreating it. Part 2 will be on testing it and stating the difference in findings and statistical significance.
Data
This research was sponsored by Richardson Online Ltd to highlight how computers, analysis and content can come together.